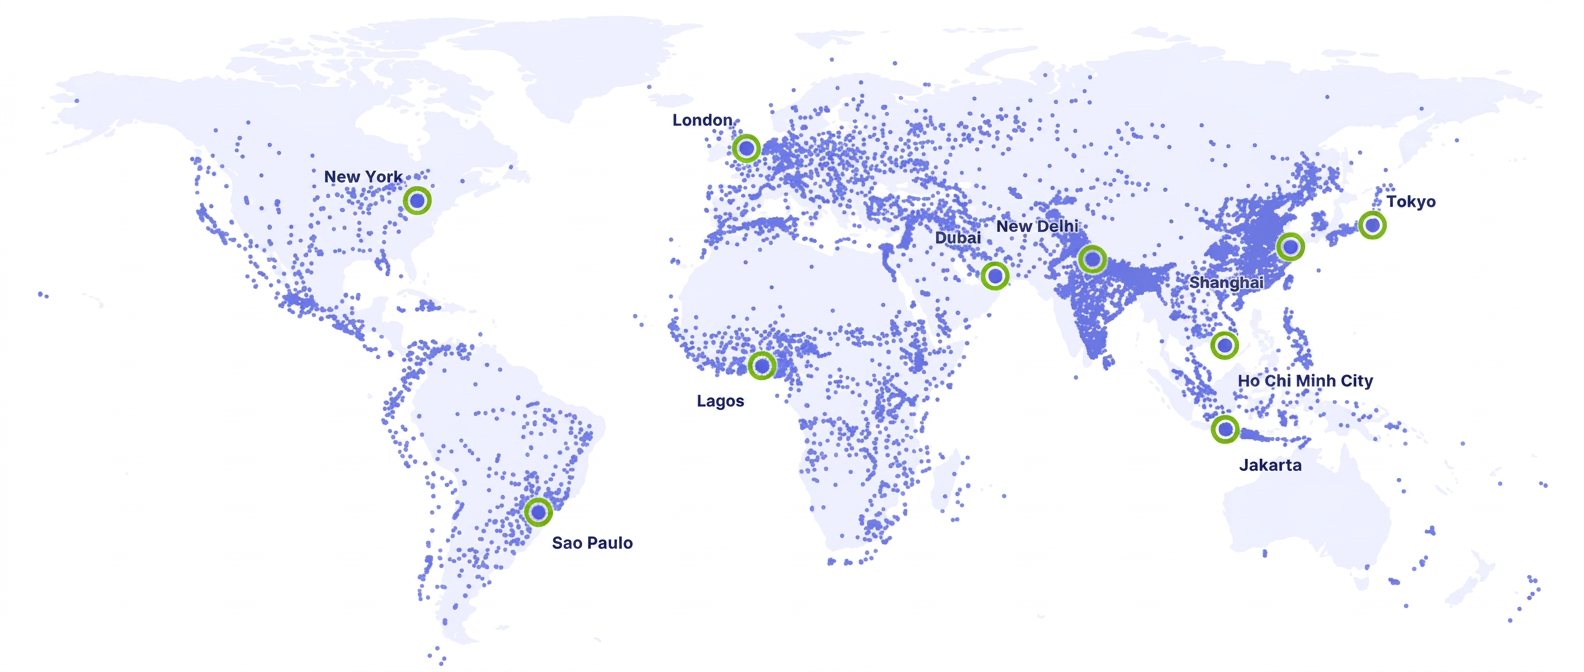
Every engagement starts from a decision someone has to make, and works back to the number that settles it. The same forecasts sit behind all of them: 194 countries to 2050, more than 9,400 cities to 2040, and 200+ categories.
194countries, 2000 to 2050
9,400+cities, to 2040
200+spending categories
16 yearsof forecasts checked against outcomes
Trusted by teams at
Five decisions we help you get right.
Market entry & prioritisation
Go where the consumers are forming
We rank every market to 2050 and every city to 2040 by the consumers you sell to, and how fast that base grows, so you expand where demand is forming.
Informs
where to enterwhere to double downwhere to wait.
Pricing & affordability
Price to what each market can afford
We map spending power in every market against your price points, so you set each price to what that market can pay.
Informs
price tierswillingness to payrevenue per market.
Category & portfolio strategy
Find the growth a flat average hides
We split one category number into hundreds of market, age and income groups, so you can move investment to the groups that are growing.
Informs
portfolio mixpremium against masswhere to invest.
Segmentation & targeting
Separate the consumers worth chasing
We split each market by generation, income and spending group, so you can aim at the cohort that carries your category.
Informs
who to targetbrand positioningmedia strategy.
Demand forecasting & sizing
Size the market that does not exist yet
We project the consumers above your affordability threshold, every market, every year to 2050, so you can size tomorrow’s addressable market with the same rigour as today’s.
Informs
long-range planningboard casesinvestment timing.
Market entry & prioritisation
Go where the consumers are forming
We rank every market to 2050 and every city to 2040 by the consumers you sell to, and how fast that base grows, so you expand where demand is forming.
Informs
where to enterwhere to double downwhere to wait.
Pricing & affordability
Price to what each market can afford
We map spending power in every market against your price points, so you set each price to what that market can pay.
Informs
price tierswillingness to payrevenue per market.
Category & portfolio strategy
Find the growth a flat average hides
We split one category number into hundreds of market, age and income groups, so you can move investment to the groups that are growing.
Informs
portfolio mixpremium against masswhere to invest.
Segmentation & targeting
Separate the consumers worth chasing
We split each market by generation, income and spending group, so you can aim at the cohort that carries your category.
Informs
who to targetbrand positioningmedia strategy.
Demand forecasting & sizing
Size the market that does not exist yet
We project the consumers above your affordability threshold, every market, every year to 2050, so you can size tomorrow’s addressable market with the same rigour as today’s.
An illustrative engagement: a beauty brand deciding where to launch premium skincare next.
Illustrative example
01
The model
Every market on one peer-reviewed model: 194 countries and more than 9,400 cities, ranked by consumer spending and its growth.
02
Your question
We point the model at your product: a category, a price, a market.
Product A: premium skincare at $40 a unit, India
18%can afford '26
39%by 2036
+148Mcross the line
03
The decision
You get the answer as a deliverable your team can act on, such as pricing scenarios for each market.
Forward-looking, granular and consistent.
4.67bn 20267.17bn 2050
World consumer class, billion people, 2026-2050. Source: World Data Intelligence.See the data
World consumer class, billion people, 2026-2050.
Year
Consumer class (billion)
2026
4.668
2027
4.791
2028
4.914
2029
5.037
2030
5.158
2031
5.28
2032
5.401
2033
5.521
2034
5.639
2035
5.756
2036
5.869
2037
5.98
2038
6.09
2039
6.199
2040
6.309
2041
6.42
2042
6.529
2043
6.629
2044
6.713
2045
6.774
2046
6.807
2047
6.832
2048
6.878
2049
6.979
2050
7.168
Forward-looking
Demand before it arrives
Because every consumer is placed and then forecast each year to 2050, you can see where demand is forming long before it reaches a sales report, and decide where to be ready for it ahead of the competition.
Modelled to 2050, every year
Indonesia47%
Jakarta99%
West Sulawesi9%
Share of people in the consumer class. Source: World Data Intelligence.See the data
Share of people in the consumer class.
Market
Consumer-class share (%)
Indonesia
47
Jakarta
99
West Sulawesi
9
Granular
An average hides consumers
National figures bury the people who matter most to a strategy: the affluent households inside a lower-income country, the squeezed ones inside a wealthy one. Indonesia’s figure, 47% of its people in the consumer class, is an average of provinces that run from 99% in Jakarta to 9% in West Sulawesi: two different markets inside one country number.
Apply consistent definitions across more than 9,400 cities
One harmonized city framework worldwide, so London, Lagos and Ho Chi Minh City are measured the same way, and comparable side by side. The same method runs across every country, and Homi Kharas's 2010 forecast of the middle class came within a few percent of what happened.